Getting started on a GIS Project

I am a GIS enthusiast. Mostly what I do is make maps, create and manage GIS softwares and I Iove R and am learning to appreciate Python. So mainly am a learner in GIS and programming and I like to explore integration of various programming algorithms with GIS.
Earlier, on The GIS Method, we looked at the steps to follow when working on a GIS project. Well, now let's put these steps into action and use them to solve a problem.
For instance, you would want to explore and share information about the distribution of population in an area, highlighting how the population varies from one region to another. One of the best ways to do this is using a map of the area that depicts the population distribution in your study area. We will use QGIS, a user-friendly Open Source GIS application for the project.
If you do not have QGIS installed, you could follow this Installing QGIS post.
The steps that we will follow include:
- Frame the question
- Explore and prepare the data
- Choose analysis methods and tools
- Perform the analysis
- Examine and refine the results
Here, we will just focus on the first two steps then look at the other steps in the subsequent posts.
Step 1. Frame the question.
The main questions that we have include:
How can we communicate the population of our study area?
How will we highlight the population variation from one region in the study area to another?
Our answer to these questions is that we will create a static map in QGIS that shows how population varies in Kenya from one county to another.
Step 2. Explore and prepare the data
To create the population map we need these datasets:
a). Kenya Counties Boundaries shapefile.
b). Kenya Population per county.
The Kenya boundaries datasets can be obtained from this GADM Repository link.
We will need the population data in csv format which can be obtained from this HDX Repository link.
Copy the downloaded datasets in one folder and unzip the gadm36_KEN_shp.zip file. We will open and explore the datasets in QGIS. So go ahead and start the QGIS desktop application.
When QGIS is open, first we will create a QGIS Project so that all we do is saved up in one place.
From the GIS Lounge:
A QGIS Project file is a configuration file which contains pointers to the GIS data used to create a project in QGIS, styling information about those layers, and any map composer setups.
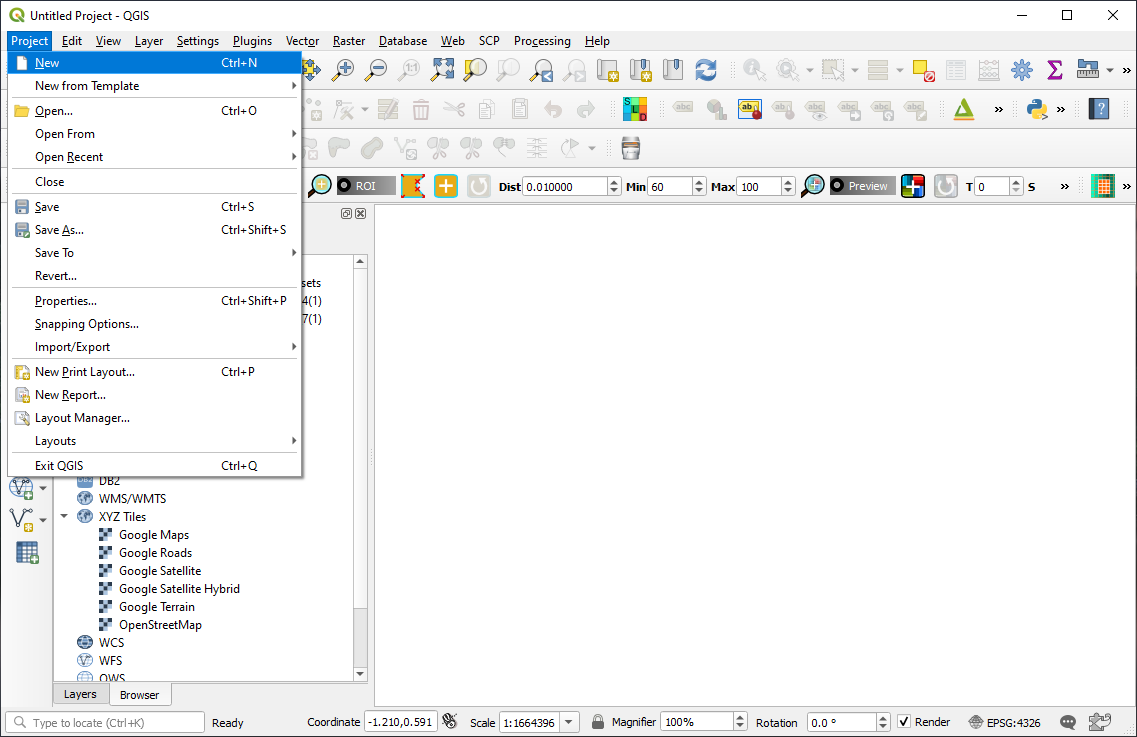
To create a new QGIS project in the menu bar, go to Project -> New.
Then save the new project by going to Project -> Save As..
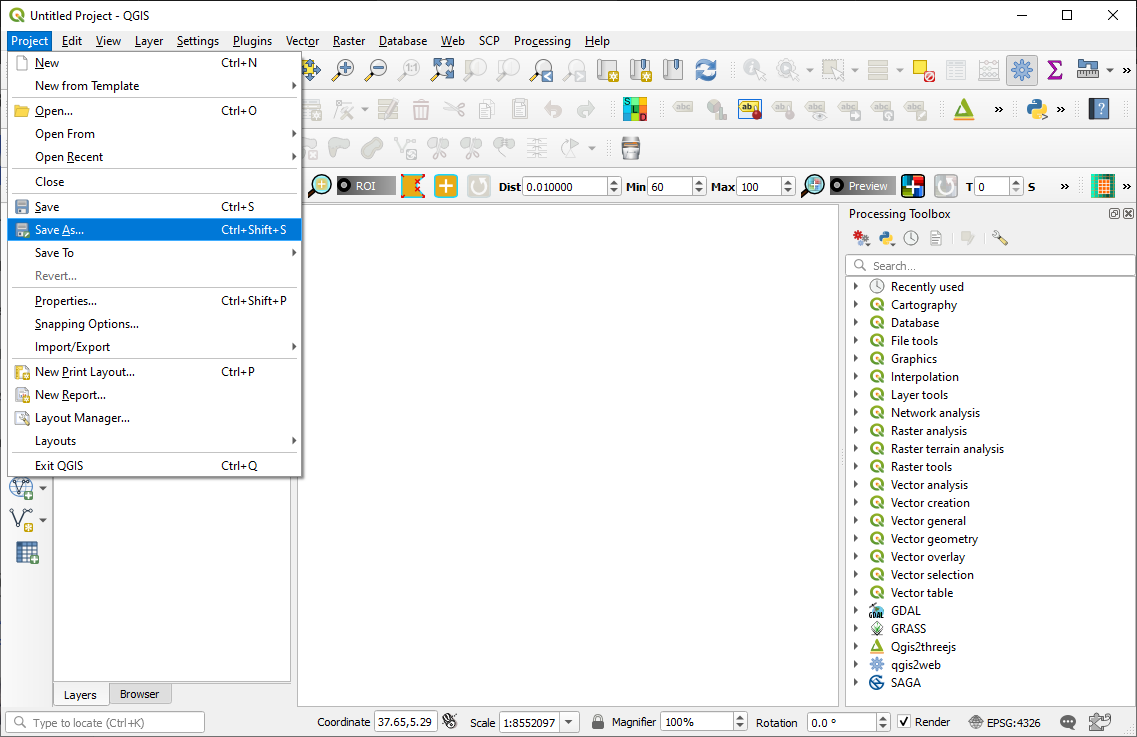
Navigate to where you want the project to be saved then give it a name. For this case the project is called Kenya_population.qgz.
In QGIS, to open the boundaries shapefile dataset, in the menu bar go to Layers -> Add Vector Layer.
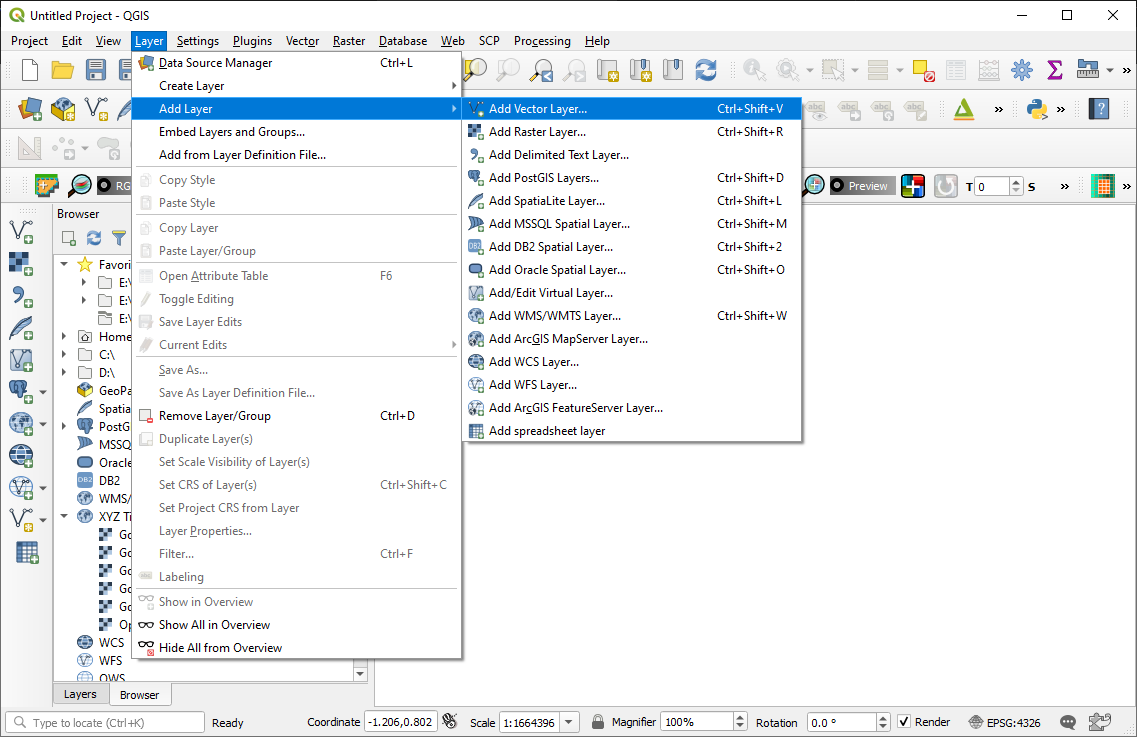
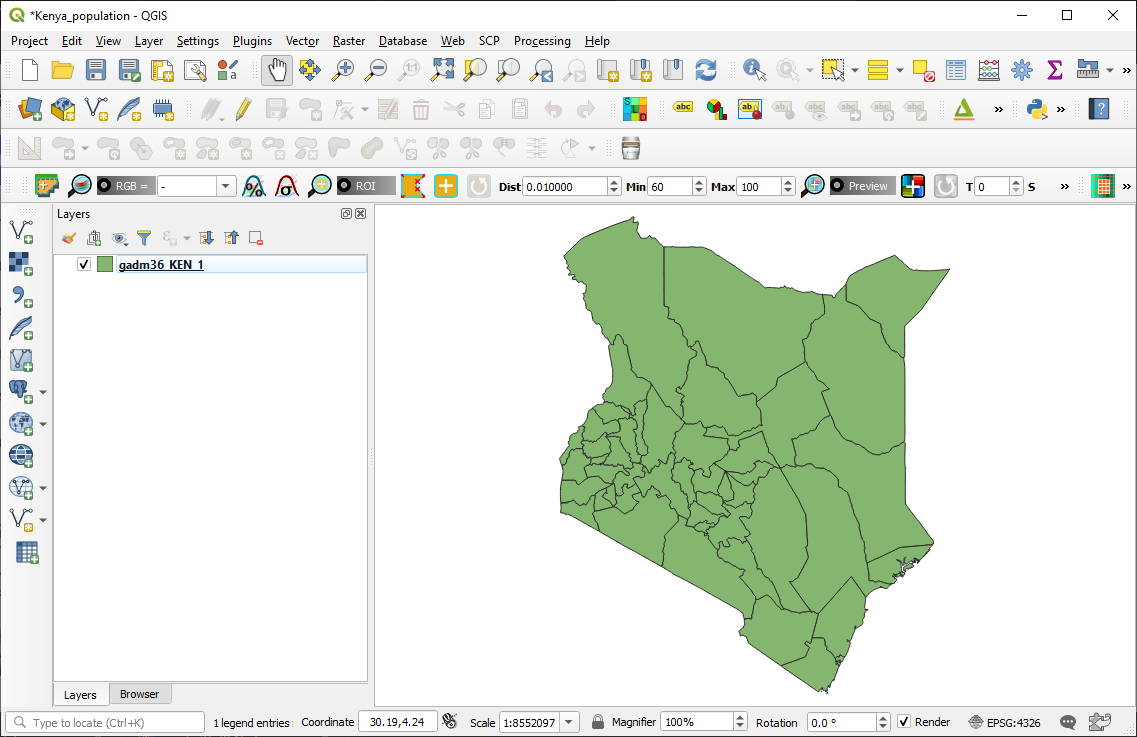
Navigate to where you saved and extracted the downloaded gadm36_KEN_shp file then open the gadm36_KEN_1.shp file, which is the Kenya counties shapefile.
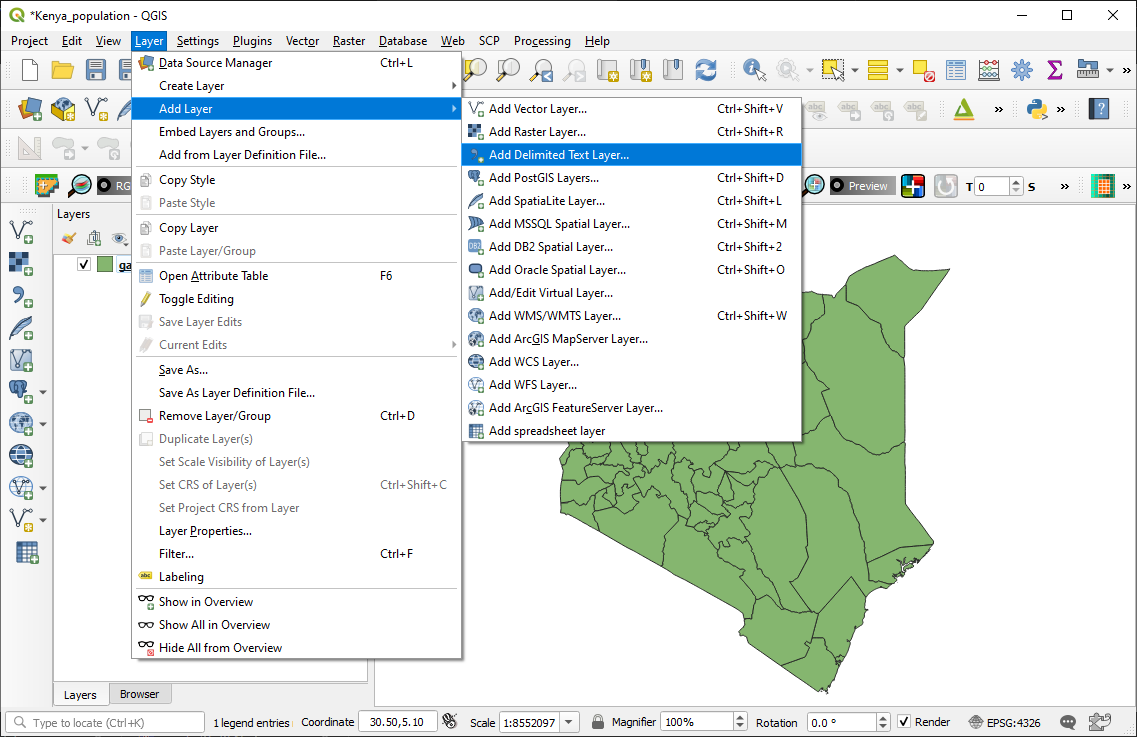
To add the population csv file, navigate to Layers -> Add Delimited Text Layer.
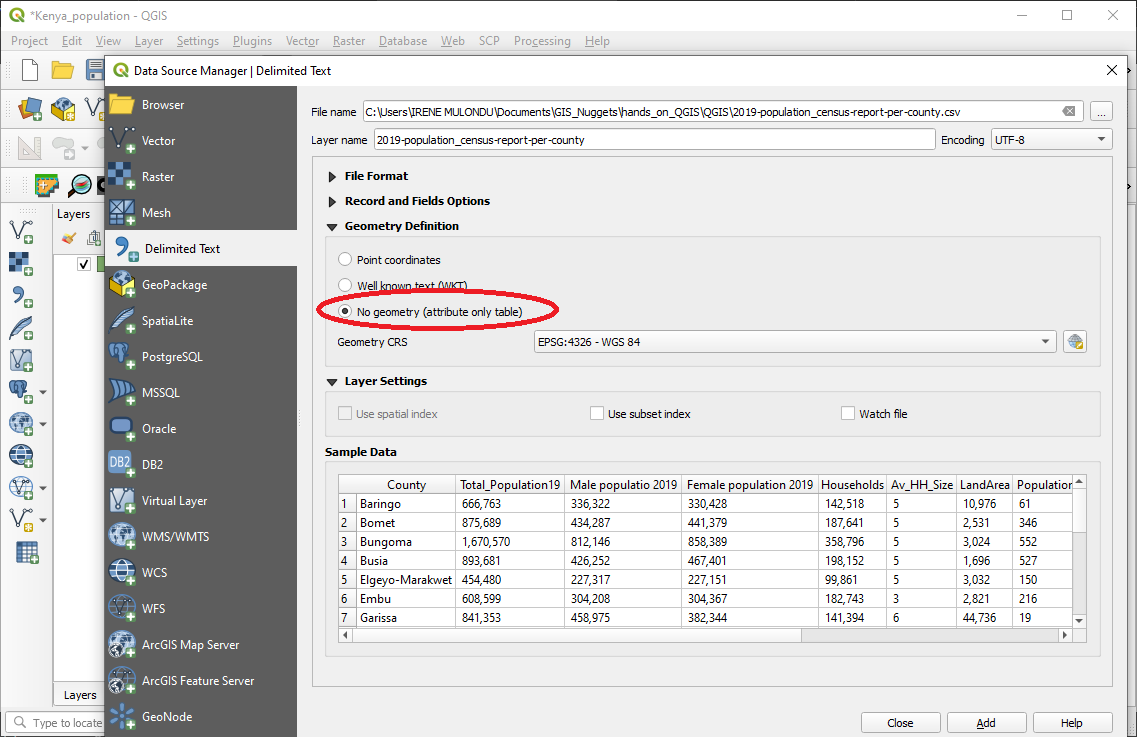
Then navigate to the folder where you saved the population csv dataset. Then in the Data Source Manager window, in the Geometry Definition Section choose the No geometry option then click the add button and then click the close button to close the window as shown below.
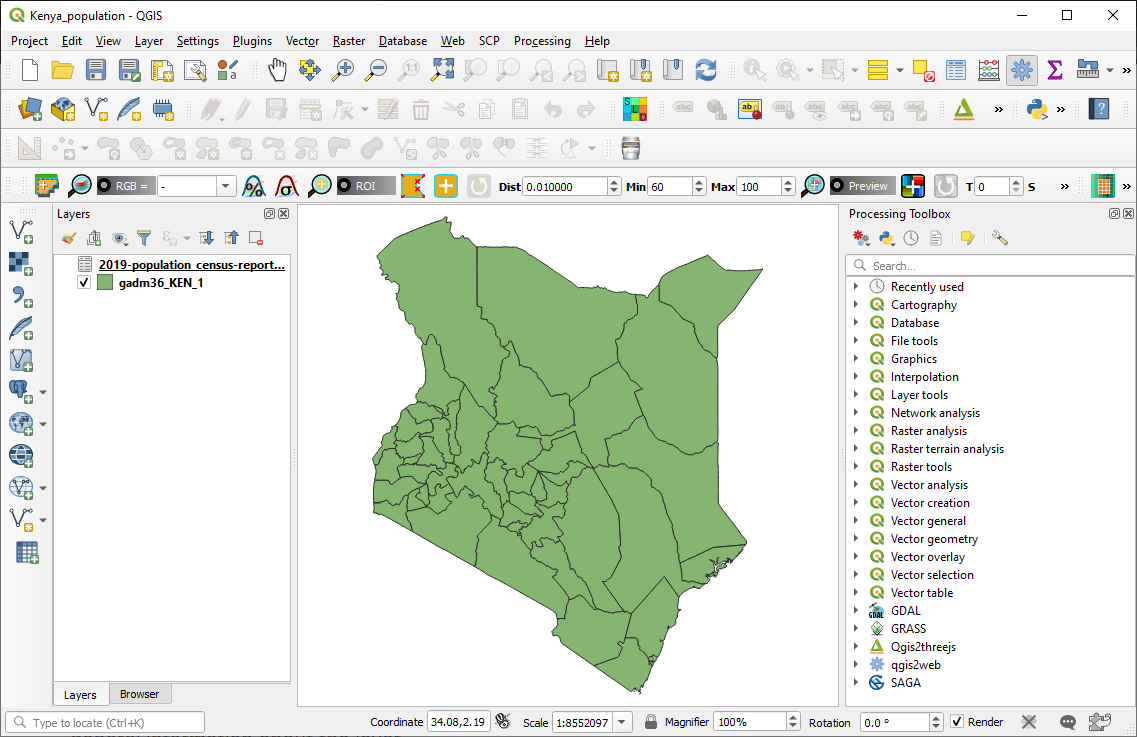
Now you have added the datasets to QGIS.
To explore the datasets, we will check the layers' properties and their attribute table.
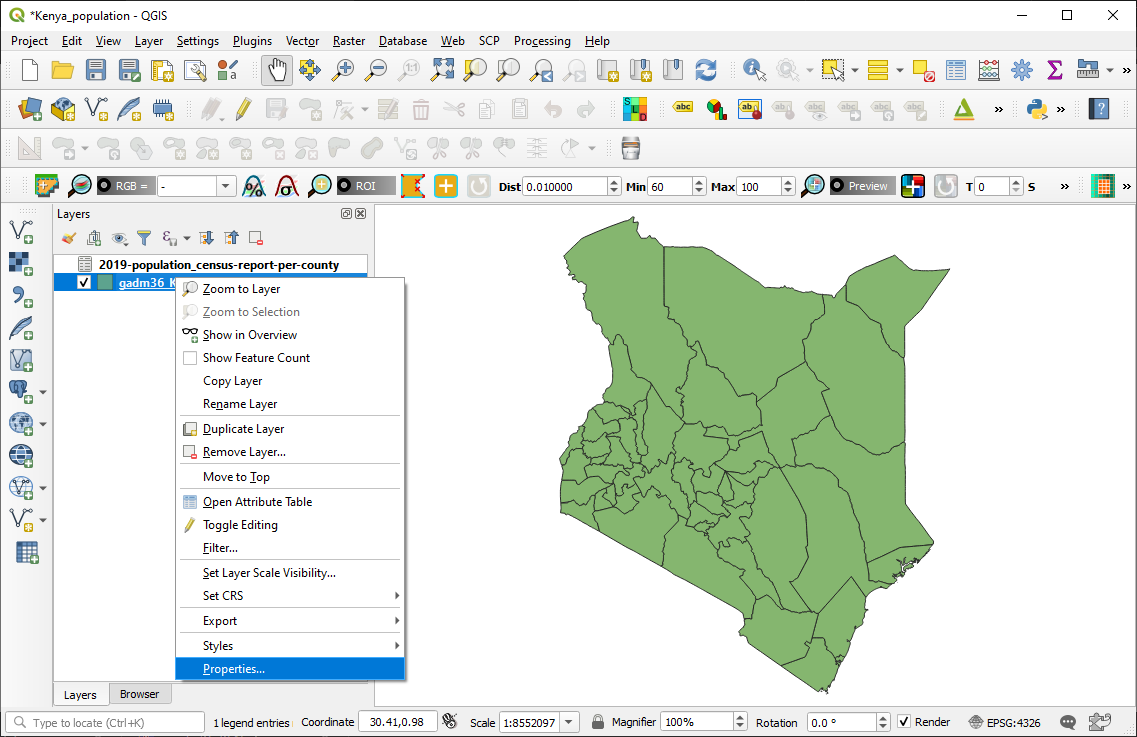
To open a layer's properties, right click on the specific layer then click on properties:
The Layer Properties dialog provides information about the layer, symbology settings and labeling options.
Click the information tab as shown below because for now we just want to check out the general information about the layer.
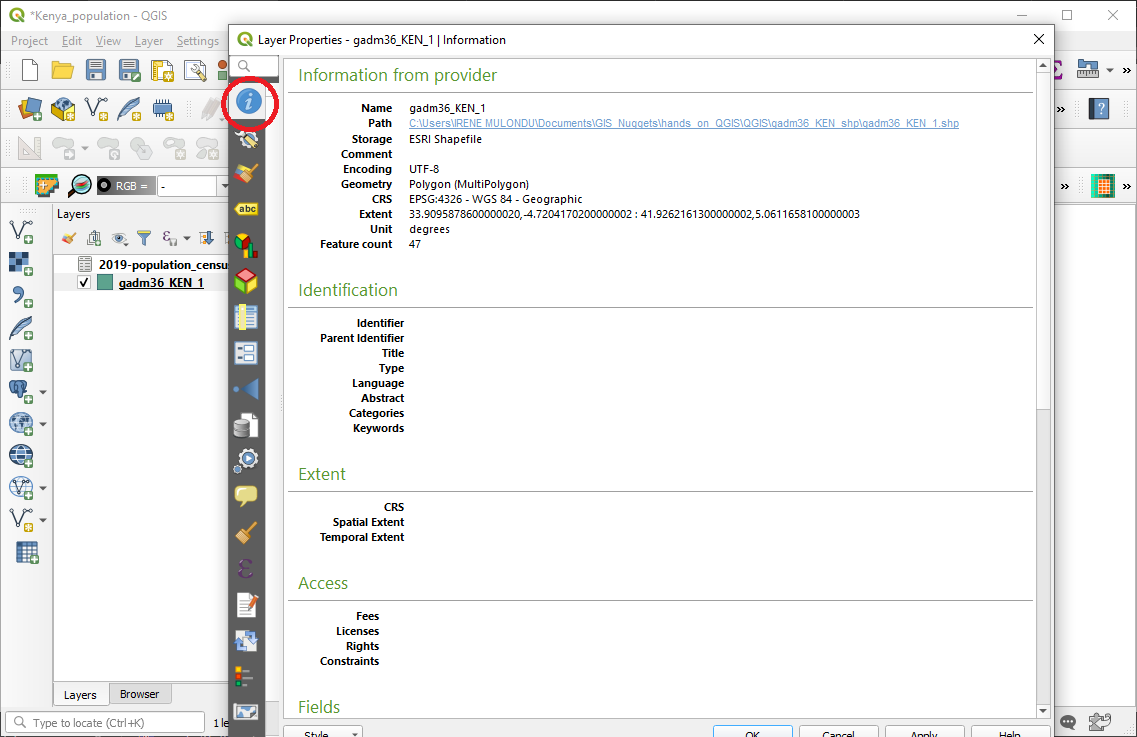
From the information dialog it is possible to see details on the dataset like the projection and the geometry type.
Close the properties dialogue after finishing.
To check out what the layers contains, you can open the attribute table by right clicking on the layer then click on Open Attribute Table.
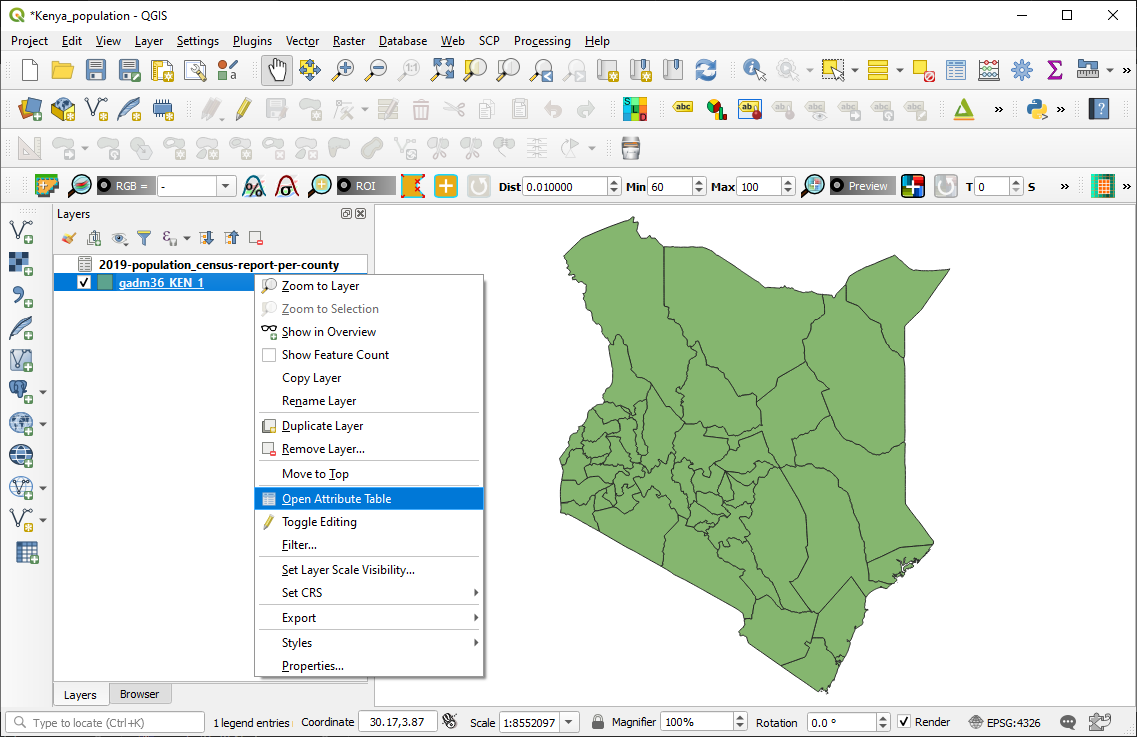
What is a layer attribute table? From the QGIS User Manual:
The attribute table displays information on features of a selected layer. Each row in the table represents a feature (with or without geometry), and each column contains a particular piece of information about the feature. Features in the table can be searched, selected, moved or even edited.
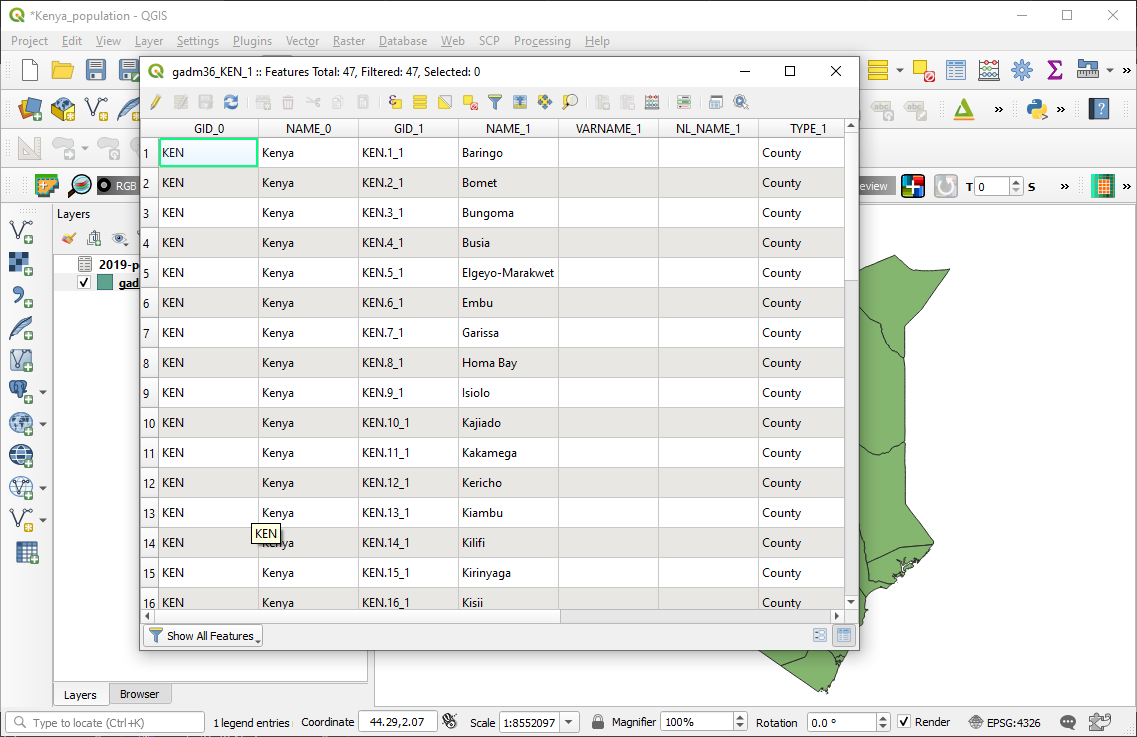
The gadm36_KEN_1 attribute table shows information on the each Kenya county features. For instance the NAME_1 column shows the name for the county.
You can also checkout the population layer attribute table to see what the dataset contains.
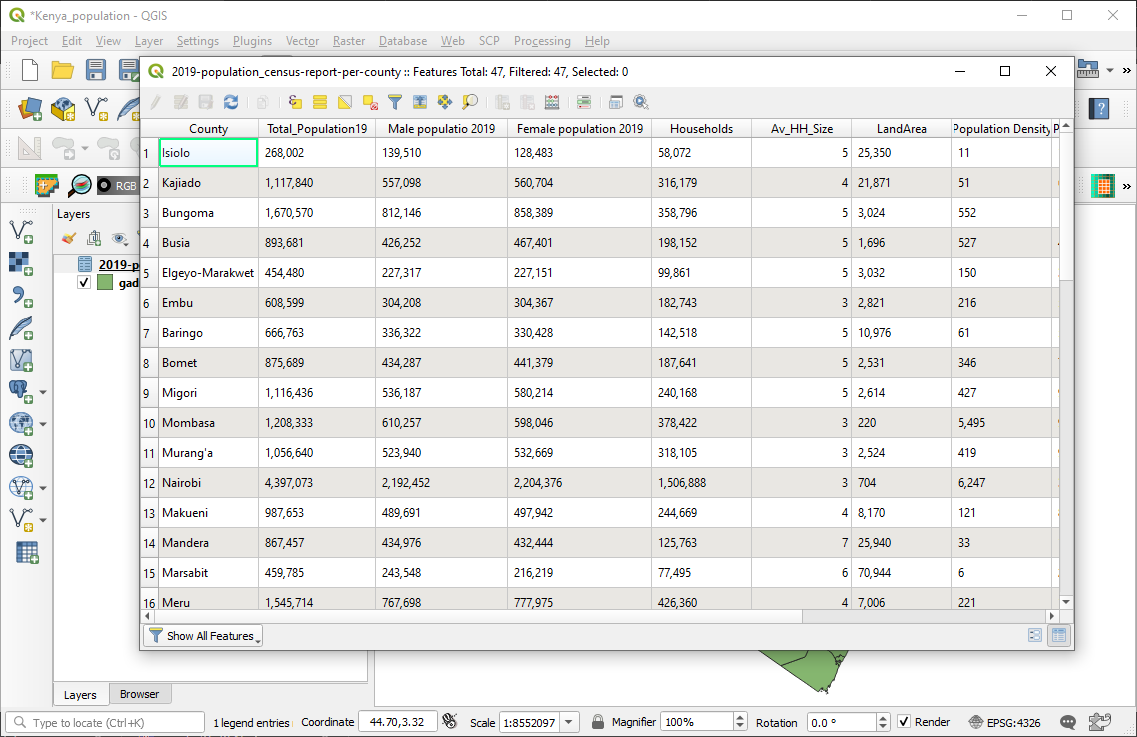
The layer contains a County column which shows the name for each county and also several columns showing the population in the specific county.
We are more concerned with the County and Total Population columns.
But since the population layer does not have the spatial extent for the counties while the counties layer does not have the population, we will create another layer that contains both of this information. The layer will be created through spatial join whereby we will join the counties boundary layer with the population layer, based on the county names in the two datasets.
To create the spatial join, open the join tool by navigating in the menu bar to Processing -> Toolbox.
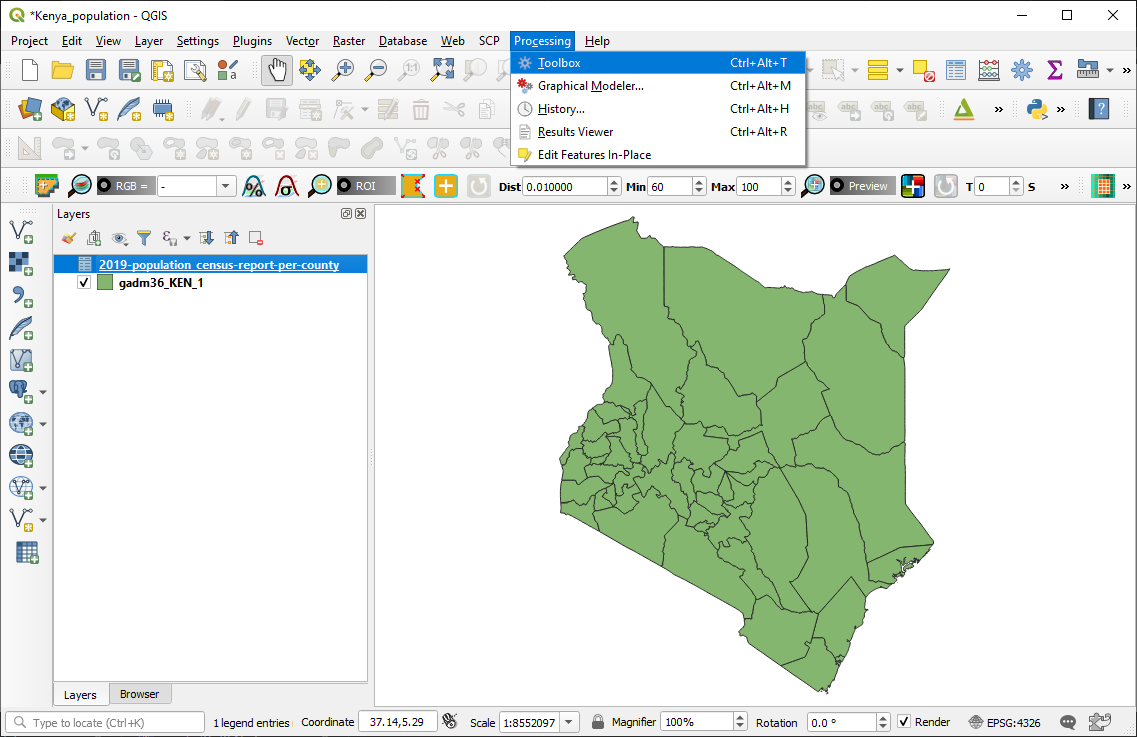
In the Toolbox panel that opens search for join then click on the Join atttribute by field value tool under Vector general section.
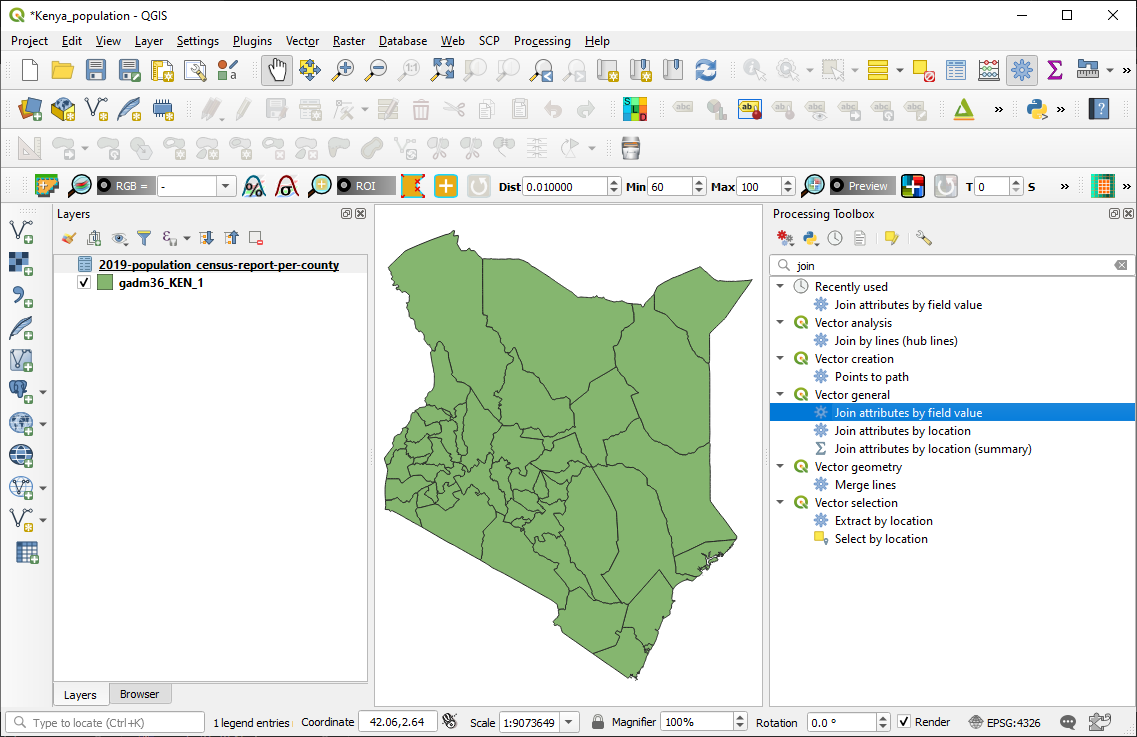
The Join Attributes by Field Value window opens up.
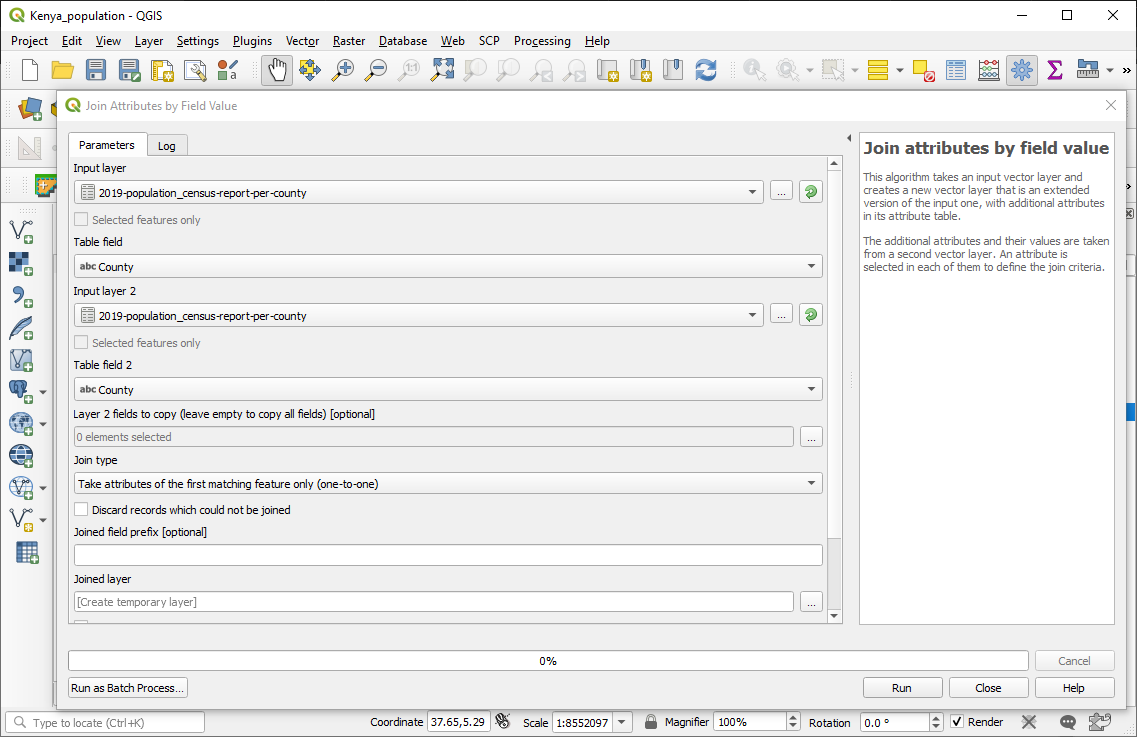
On the right of the window there is a description of the tool.
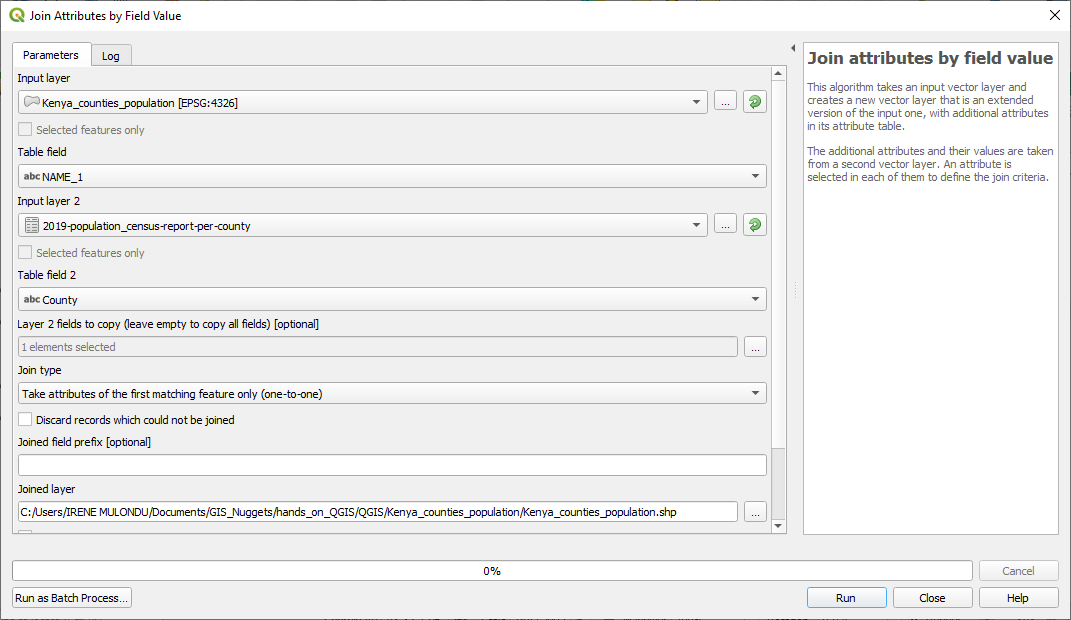
Fill in the Join Attributes by Field Value window sections as shown below:
In the input layer section, select the gadm36_KEN_1 layer.
In the Table field section, select the NAME_1 field.
For Input layer 2 section, select the 2019-population_census-report-per-county layer.
In the Table field 2 section, select the Total_Population19 field.
In the Layer 2 fields to copy section, select the Total_Population19 field.
In the Joined layer section, select the ... button and choose the Save to File option then navigate to where you want to save the file. Name the file as Kenya_counties_population.shp.
It should be filled as shown below.
The files will be processed then a shapefile containing the joined dataset will be created and loaded to the QGIS project.
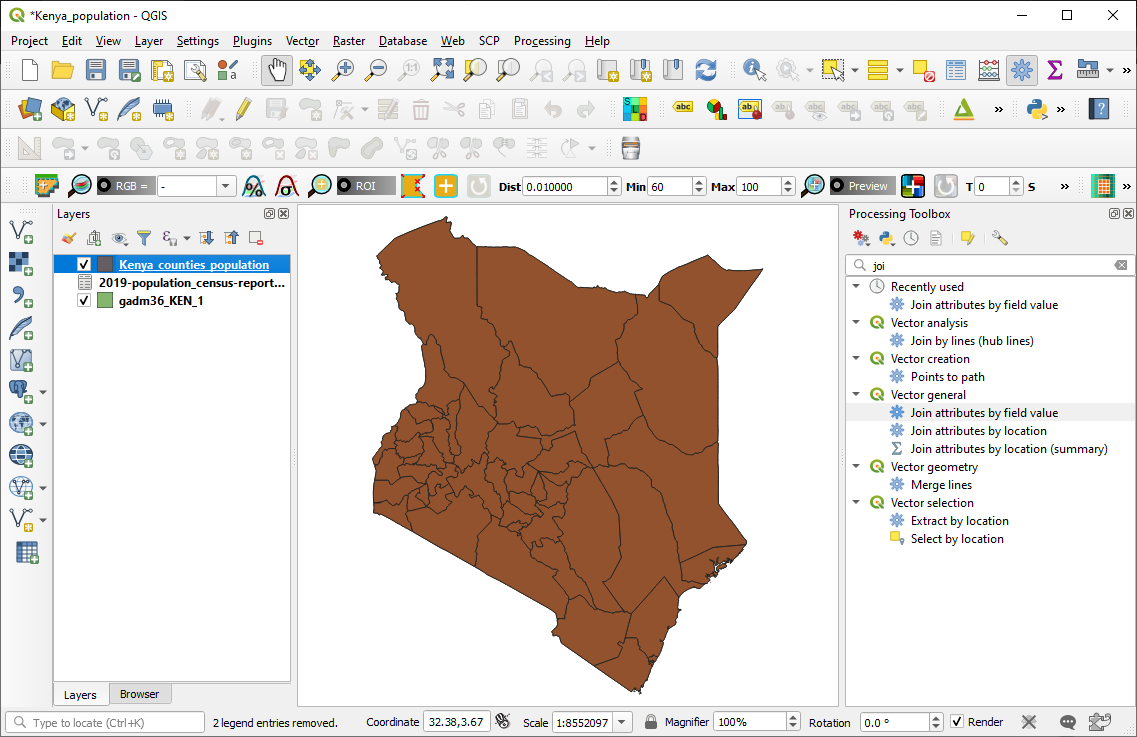
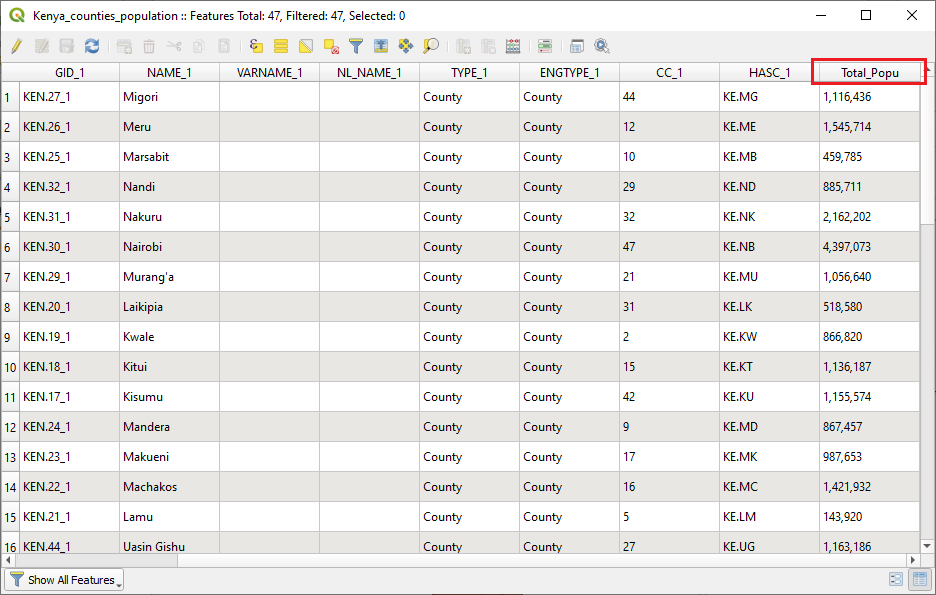
Open the attribute table of the Kenya_counties_population layer. You will notice that in addition to the columns in the gadm36_KEN_1 layer it also has the Total_population19 column.
Note: Remember to always save your QGIS project.
Well, isn't this amazing! We have looked at the problem we want to solve then obtained and explored the data that we will process to be obtain the solution to our problem.
So stay tuned for the next part of where we will follow the next GIS Method steps to solve our problem.
Remember, if there is anything you would need clarification, feel free share in the comment section.


