About GIS Datasets

I am a GIS enthusiast. Mostly what I do is make maps, create and manage GIS softwares and I Iove R and am learning to appreciate Python. So mainly am a learner in GIS and programming and I like to explore integration of various programming algorithms with GIS.
Any scientific project is driven by data including GIS projects! So what about GIS datasets, why is it that they appear to be different? The uniqueness of GIS datasets is that they have a geographic component. So does this uniqueness bring a change on how these datasets are? Well, let's explore this and also the places where we can get some GIS Datasets.
Before we go any further on GIS datasets, let us look at their geographic component. The geographic component in GIS datasets is normally a way of defining how features on the ground could be mapped. This is done through a process called projection.
What is Projection?
Well, the short answer is that the earth is a three dimensional sphere and your screen is two dimensional and flat. So in order to display the earth on your screen it needs to be flattened.
The flattening process creates distortions, and this is the reason that on some maps Greenland looks the same size as the whole of South America.
There are many different formulas of flattening the earth, each designed to cause less distortion in specific places on earth.
You don’t need to understand how this process works as the data you use will already have the correct coordinate system. And if you are making a new dataset, the default coordinate system used in most GIS systems, that is WGS84, will be suitable 99% of the time.
Now that we have looked at projection, let's look more deeply at the GIS Datasets themselves!
GIS integrates many different kinds of data layers using spatial location. GIS data includes imagery, features, and basemaps linked to spreadsheets and tables.
GIS datasets can be categorized in two:
- Vector Data
- Raster Data
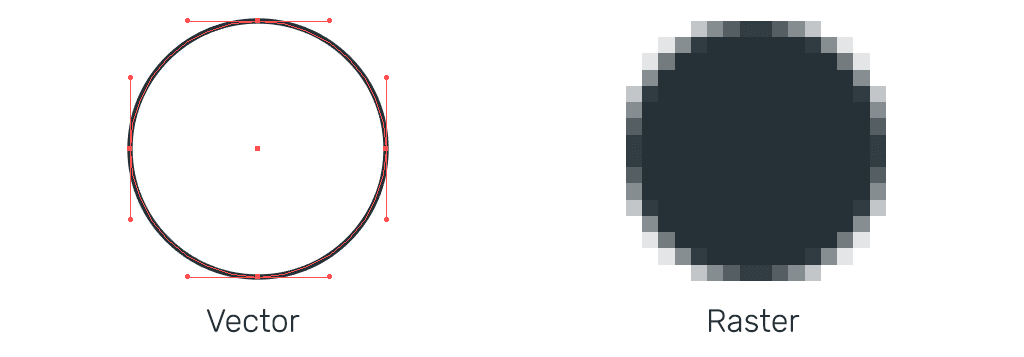
A. Vector data
Vector data structures represent specific features on the Earth’s surface, and assign attributes to those features.
Vectors are composed of discrete geometric locations (x, y values) known as vertices that define the shape of the spatial object.
The organization of the vertices determines the type of vector that we are working with. It could be: point, line or polygon.
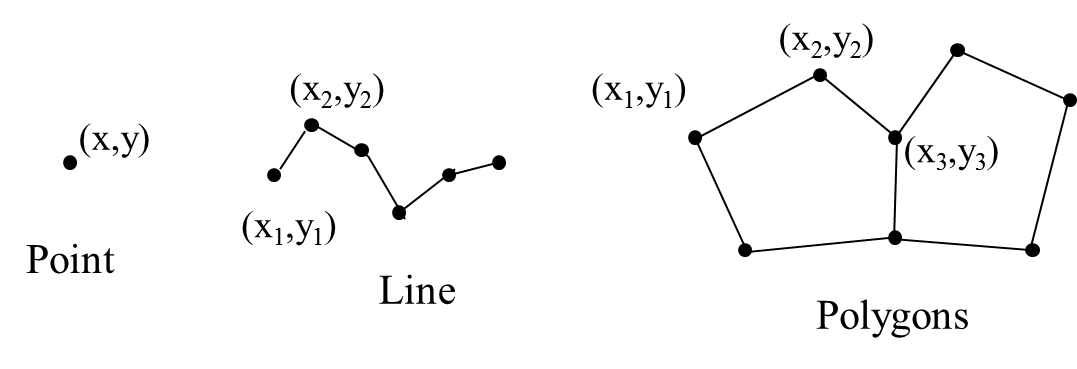
Points are individual x,y locations. Examples include center point of plot location, tower location or a town datasets.
Lines are composed of many (at least 2) vertices, or points that are connected like roads and streams.
Polygons are 3 or more vertices that are connected and closed. For example buildings and lakes.
Vector formats
This is how the datasets are saved.
Common GIS Vector data formats include:
- Shapefile
- Smart Data Compression
- Geodatabase
- Geopackage
- GeoJSON
1. Shapefile
The ESRI Shapefile has become an industry standard geospatial data format, and is compatible to some extent with practically all recently released GIS software.
To have a complete shapefile, you must have at least 3 files with the same prefix name and with the following extensions:
- .shp = shapefile
- .shx = header
- .dbf = associated database file.
Additionally, you may have a
- .prj = Projection file,
- .lyr = layer file,
- and other index files.
All these files must be saved in the same workspace.
2. Smart Data Compression (SDC)
SDC is ESRI's highly compressed format, which is directly readable by ArcGIS software.
3. Geodatabase (GDB)
The file geodatabase is a collection of geographic datasets of various types, with the most basic types being vector, raster, and tabular data.
There are three types of geodatabases:
- File geodatabase
- Personal geodatabase
- Enterprise geodatabase
Geodatabases are the native data format for ESRI's ArcGIS.
4. GeoPackage
A GeoPackage (GPKG) is an open, non-proprietary, platform-independent and standards-based data format for geographic information system implemented as a SQLite database container. Like a geodatabase, a geopackage can contain a collection of various types of vector datasets.
5. GeoJSON
GeoJSON is a data format for displaying vectors in web maps. It is based on JavaScript Object Notation, a simple and minimalist format for expressing data structures using syntax from JavaScript.
In GeoJSON, a vector feature and its attributes are represented as a JavaScript object, allowing for easy parsing of the geometry and fields.
GeoJSON consists of the following different parts:
- Geometry object: This is either the point, line, or polygon. Basically the location information.
- Feature object: This is the geometry object and the associated data..
- FeatureCollection: This is a list of feature objects.
An example of a GeoJSON:
{
  "type": "FeatureCollection",
  "features": [
    {
      "type": "Feature",
      "geometry": {
        "type": "Point",
        "coordinates": [ -90.0715, 29.9510 ]
      },
      "properties": {
        "name": "Fred",
           "gender": "Male"
      }
    },
    {
      "type": "Feature",
      "geometry": {
        "type": "Point",
        "coordinates": [ -92.7298, 30.7373 ]
      },
      "properties": {
        "name": "Martha",
           "gender": "Female"
      }
    },
    {
      "type": "Feature",
      "geometry": {
        "type": "Point",
        "coordinates": [ -91.1473, 30.4711 ]
      },
      "properties": {
        "name": "Zelda",
        "gender": "Female"
      }
    }
  ]
}
At the top level you can see the definition of FeatureCollection, or list of data. Then definition of features, which is an array of Feature objects. Each Feature has a geometry object and a properties object. The geometry object will either be a Point, LineString, Polygon, MultiPoint, MultiLineString, or MultiPolygon. Each type should be self-explanatory but certainly leave a comment if any aren’t clear. Inside properties you can see it has been specified both a name and gender value for each feature.
B. Raster Data
Raster datasets are composed of a series of grid cells where each cell has a value representing the feature being observed.
Rasters are best suited for continuous data, or information that does not have hard boundaries or locations like for modeling surfaces like elevation, temperature, precipitation, or soil Ph. These phenomena are measured at intervals, and values in between are interpolated to create a continuous surface.
Raster data also includes remote sensing imagery, like aerial photography and satellite imagery.
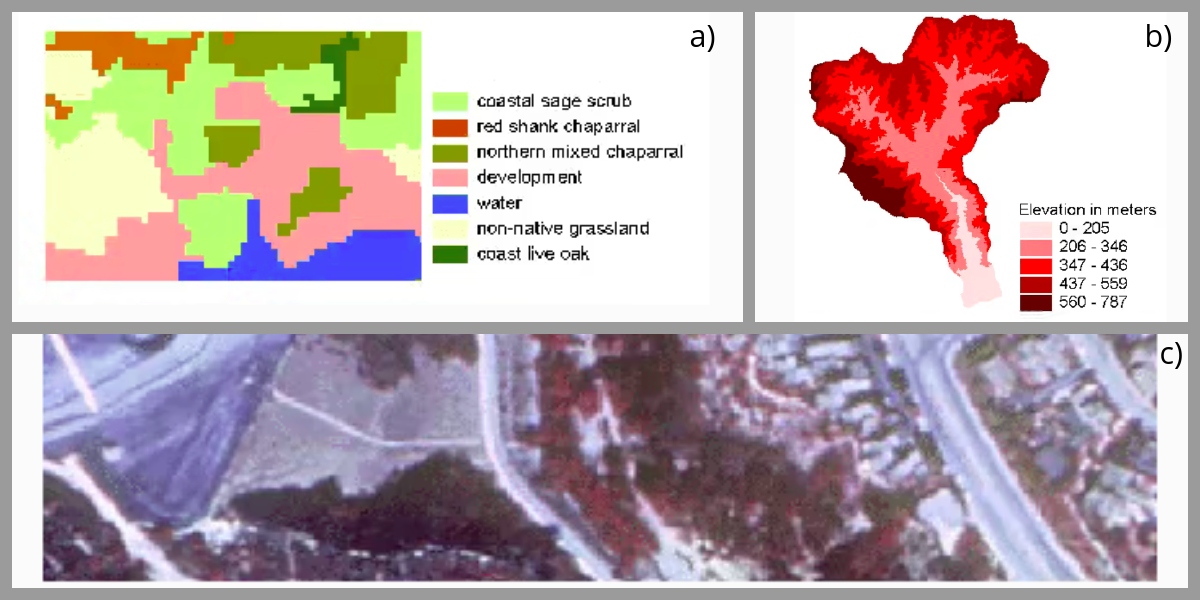
In the above image: a) is a classified raster output; b) is a DEM (Digital Elevation model) and c) is an aerial imagery.
Raster formats
Common raster formats include:
- ESRI ArcInfo Grid
- GeoTIFF
- ECW
- ERDAS IMAGINE File Format (IMG)
1. ESRI ArcInfo Grid
ESRI ArcInfo Grid (ESRI_grid), also known as ArcInfo Grid is for mainly ArcGIS. An ArcInfo Grid does not have an individual file extension. Instead it is composed of two folders within a "workspace" which each contain multiple files. One of the two folders carries the name of the grid, and contains a number of various .adf files. The other folder is an "info" folder, which typically contains .dat and .nit files for all the coverages and grids in the workspace.
2. GeoTIFF
GeoTIFF(.tif) is the most commonly used raster data format. GeoTIFFs are compatible with nearly all CAD and GIS applications and maintain their quality when compressed, edited, and transferred.
3. ECW
ECW (Enhanced Compression Wavelet) is a proprietary wavelet compression image format optimized for aerial photography and satellite imagery. Compared to .tif files, .ecw files have a compression ratio of 1:20.
4. ERDAS IMAGINE File Format (IMG)
ERDAS IMAGINE File Format (IMG) is a proprietary, partially documented format for multi-layer geo-referenced raster images developed originally for use with ERDAS IMAGINE software. This format is used widely for processing remote sensing data, since it provides a framework for integrating sensor data and imagery from many sources.
Sources of GIS Datasets
Some open source GIS Data repositories include:
- GADM data repository.. This contains boundaries datasets for all countries
- USGS Earth Explorer. This contains worldwide satellite images, aerial photographs, and cartographic products from the U.S. Geological Survey.
- HDX. This contains humanitarian data.
- Google Earth Engine. This is a planetary-scale platform for Earth science data & analysis.
- Geofabrik Data Server. This server has data extracts from the OpenStreetMap project which are normally updated every day.
- MAP. The Malaria Atlas Project contains various datasets like accessability to cities, travel time to health facilities, among others.
- World pop. This contains Open spatial demographic data and resources.
References
For more detail, you can visit the links below:
a. GIS Data


